How to Clean Time-Series Data Without Destroying the Signal

Cleaning time-series data can feel like tidying a messy room: remove what looks wrong, smooth the rough edges, and assume a neater dataset means a better model. Unfortunately, that instinct often backfires. Time-series data carries meaning in its spikes, dips, and irregular moments, so scrubbing too aggressively can erase the exact signal your model needs to learn. The challenge, therefore, is balance. You want to remove genuine errors without flattening the real-world behavior hiding inside the noise.
This guide walks through how to approach time-series data cleaning the right way: what the process is really for, the specific strategies that fix dirty data without harming it, why no single method works everywhere, and how to handle missing values while keeping the signal intact.
The Real Goal of Time-Series Data Cleaning
You should have a clear idea of what you are cleaning for before deleting any rows. Don’t be under the impression that the goal is to produce a spotless spreadsheet. What you want to do is cull the noise and let the signal show; in that way, your model can pick up on the true behavior of the system as time goes on.
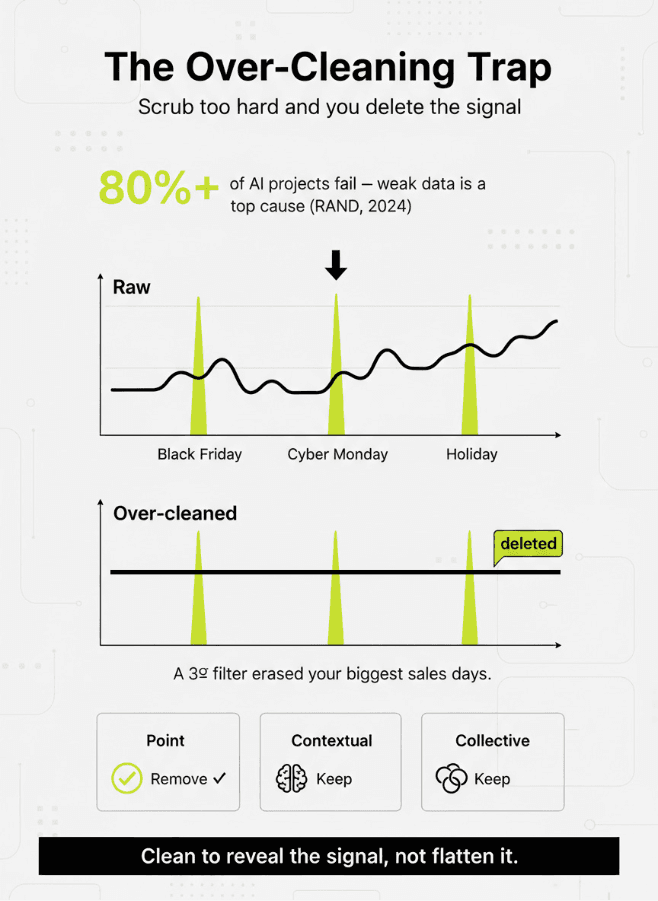
It is an important distinction given how expensive it is to get your data wrong. According to the RAND Corporation, some 80% of AI projects come to nothing, double the rate of non-AI IT work, with a poor data foundation being cited as a prime reason for the failure. (https://www.rand.org/pubs/research_reports/RRA2680-1.html)
The problem is common enough. 500 U.S. AI professionals were tested in a survey, and 81% of their companies were still having trouble with data quality. (https://www.qlik.com/us/news/company/press-room/press-releases/data-quality-is-not-being-prioritized-on-ai-projects)
The point is straightforward: if you don’t clean enough, mistakes will get by; overdo it, and you have removed the very signal you need. In the end, you are left with a neat-looking set of figures but bad training data for your model.
Why Over-Cleaning Destroys the Signal
One of the most common mistakes in time-series data cleaning is treating every unusual observation as an error. In reality, not every anomaly is dirty data.
Not Every Anomaly Is an Error
You will find that in most systems an anomaly is a reflection of something actual, be it a spike in demand, some operational hiccup, a piece of equipment giving out, or customers changing their ways. The trick is to put them in the right category. Take a point anomaly, for instance: a solitary figure at odds with its surroundings, typically a bad reading. Then you have the contextual kind, where a value is only odd given the circumstances, like seeing high heating consumption in the middle of summer. A collective anomaly is when you have a string of points that point to a real shift in how the system is acting, say, from a sensor drifting slowly or a traffic surge that won’t let up. You can safely cull point anomalies due to errors, but as a rule, keep the signal in they are down to an error, but as a rule, you want to hold on to the signal in the contextual and collective ones.
How Clipping the Tails Backfires
There is no doubt you can get a neater dataset by culling the odd observation. But be careful, for in the process, you may clip off the tails of the distribution that your model relies on to generalize. Take a retailer who has put two years of daily sales through the wringer. Some automated rule will flag anything over three standard deviations from the mean as an outlier and have it removed. In so doing, it will remove Black Friday, the holiday rush, and any flash-sale spikes from the data. These are the high-demand occurrences that the forecasting model ought to be able to predict, but they have disappeared. You are left with a tidy file that has lost what was most instructive about it. Better to employ some robust means of telling noise apart from the signal than to iron out every irregularity into something smooth and lifeless.
Core Time-Series Data Cleaning Strategies
You have to keep the right balance when you go about this work, which falls into four parts:
Finding the real errors
Putting the time axis in order
Filling in what is missing
Smoothing out the noise
At every stage, some methods safeguard the signal while others can quietly destroy it, so your choice of approach and sequence is crucial.
Detecting Outliers Without Removing Real Events
Because blunt thresholds do so much damage, detection deserves more care than a single global rule. A plain z-score flags points that sit too many standard deviations from the mean, but it breaks down when the data has trends or seasonality, and a few extreme values can distort the mean itself. A modified z-score based on the median and median absolute deviation (MAD) is far more robust, since the median resists the pull of outliers. The interquartile range (IQR) method, which flags points outside roughly 1.5 times the IQR, is similarly resistant and easy to reason about.
The bigger upgrade, though, is adding context. Rather than judging each point against the whole series, evaluate it against a rolling window of nearby values, so a spike is compared to its local neighborhood instead of a distant global average. The Hampel filter formalizes this by applying a MAD-based test inside a sliding window. For data with strong seasonality, STL decomposition (Seasonal-Trend decomposition using Loess) splits a series into trend, seasonal, and residual components; you then hunt for outliers only in the residual, which prevents the cleaner from mistaking a normal seasonal peak for an error. These context-aware methods are how you keep the contextual and collective anomalies that matter.
Aligning and Resampling the Time Axis
Many cleaning errors trace back to a single skipped step: getting the time axis in order first. Time-series methods assume a coherent timeline, so alignment comes before imputation or smoothing.
Start by standardizing time zones and resolving daylight-saving shifts, then handle duplicate timestamps, deciding whether to keep the first reading, average the values, or treat them as a logging bug.
Next, regularize the sampling. Downsampling aggregates high-frequency data into coarser buckets (for example, per-second readings into per-minute means, sums, or maxes), which reduces noise and storage.
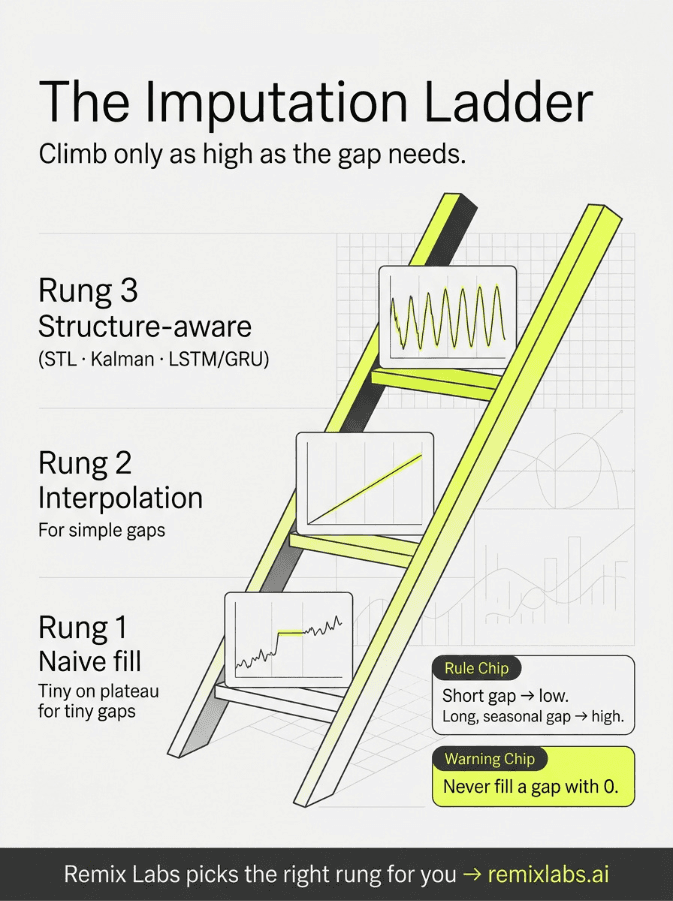
Upsampling moves to a finer grid and necessarily creates gaps that imputation must later fill. Crucially, resist filling those new gaps with zeros, because a zero is a real measurement, not a placeholder for "unknown." Conflating missing values with true zeros is one of the most common ways teams inject dirty data while believing they are removing it.
Imputing Missing Values: A Method Ladder
Imputation is the most perilous of any cleaning step. Filling in the blanks can be very destructive to your signal, especially because it is so easy to put in a fix.
Rung 1: Naive fills (only for tiny gaps)
Forward and backward fill: Carry the last or next known value into the gap. Fine for brief gaps in slow-moving signals, but they create flat plateaus over longer stretches.
Rung 2: Interpolation (simple, smooth gaps)
Linear interpolation: Draws a straight line between known points. Fast and reasonable for tiny gaps, yet over a longer stretch, it erases the dip, spike, or daily cycle in between and replaces it with a flat ramp.
Spline or polynomial interpolation: Bends to follow curvature, which helps for smooth signals but can overshoot wildly near sharp changes.
Rung 3: Structure-aware methods (complex, seasonal data)
Seasonal imputation (STL-based): Fills a gap using the typical pattern for that point in the cycle, so a missing Monday-morning value is rebuilt from other Monday mornings.
Kalman smoothing and state-space models: Look at the series as a system that changes over time and guess the most likely value based on what has happened before and after.
Learned sequence models (LSTM, GRU): Capture nonlinear, long-range dependencies, reconstructing missing stretches that respect rhythm, momentum, and seasonality at once.
Smoothing and Denoising Safely
Then there is smoothing to deal with the noise, but this is also where you are most likely to over-clean. You can put in a simple moving average without much trouble, but it will blunt any sharp edges and tend to lag.
An exponentially weighted moving average (EWMA) is more responsive to recent data and will quiet the jitter.
Or take a Savitzky-Golay filter: by fitting a polynomial in a sliding window, it does a much better job of keeping the true height and width of peaks than a run-of-the-mill average while still getting rid of the noise.
In the end, make your window as tight as you can. The more points you throw into the average, the more signal you give up for the sake of smoothness. Smoothing ought to be a light touch in your pipeline, not something you go heavy on.
How Remix Labs Simplifies Time-Series Data Cleaning
There’s no reason to spend time and risk errors when you can do it by hand; pulling these strategies together is slow for that very reason. That is what Remix Labs was made for. As a no-code platform for time series, its cleaning tools will put your dirty data in order while leaving the signal intact. But it comes down to three things that are of real importance.
Learned Imputation, Not Just Interpolation
Remix Labs will not simply join the dots with a straight line where data is absent. The platform calls on sequence models like LSTM and GRU to do the job of filling in the blanks. Since they are adept at picking up on long-range, nonlinear patterns, these models put missing pieces back together in a way that stays true to the series’ momentum, seasonality, and rhythm rather than just smoothing everything out.
The Right Method for Each Gap
We don’t do one-size-fits-all cleaning at Remix Labs; we let the task dictate the approach. If you have a small, straightforward gap, there is no sense in overcomplicating it; quick linear interpolation will do.
But when you are dealing with a longer absence in a series that has real long-range dependencies, you need to put a learned model to work. This approach is similar to what imputation research has shown us.
Signal-Preserving Preprocessing
There is a deterministic layer under the imputation to do the necessary work of normalization, scaling, smoothing, and cropping. It is there to put in the groundwork and standardize the series in a uniform way without warping it. Since the whole process is a no- A fully reproducible code pipeline means you are not left to wonder whether an ad hoc script has caused problems; you can audit or even undo any transformation at will.
In the end, these tools give you the means to correct actual errors and plug the holes while leaving the irregularities that are meant to be there. That is what good time series analysis is all about. You end up with tidier inputs and less chance of a model being silently trained on poor data, so there are fewer unpleasant surprises down the line.
Conclusion: Clean Smart, Not Just Hard
In the end, you are left with a balancing act when it comes to time-series data cleaning. The objective is to get rid of the bad data, genuine errors, duplicates, misaligned timestamps, and so on. But you do not want to obliterate spikes and outliers, for they contain the true signal. Experience shows that the risk is seldom under-cleaning; you are more likely to overdo it.
Be over-aggressive in your scrubbing, and you will flatten the kind of behavior your model is looking for. There is no one-size-fits-all approach for every series, so you must make considered, context-driven calls at every turn, whether for detection or smoothing. Our advice is to show some restraint: align and deduplicate with care, put outliers in their proper context before acting on them, and impute any gaps in keeping with the data’s natural rhythm. If you are after a way to clean your time-series data that is both quicker and more dependable and won’t compromise the signal, then you should look at upgrading your workflow.
Get started at https://remixlabs.ai/.